Python Call Graph
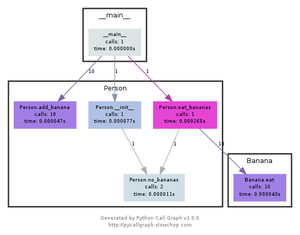
Welcome! Python Call Graph is a Python module that creates call graph visualizations for Python applications.


Screenshots
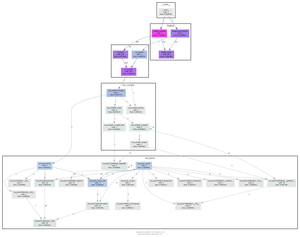
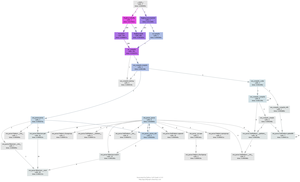
Click on the images below to see a larger version and the source code that generated them.


Project Status
The latest version is 1.0.1 which was released on 2013-09-17, and is a backwards incompatbile from the previous release.
The project lives on GitHub, where you can report issues, contribute to the project by forking the project then creating a pull request, or just browse the source code.
The documentation needs some work stiil. Feel free to contribute :)
Features
- Support for Python 2.7+ and Python 3.3+.
- Static visualizations of the call graph using various tools such as Graphviz and Gephi.
- Execute pycallgraph from the command line or import it in your code.
- Customisable colors. You can programatically set the colors based on number of calls, time taken, memory usage, etc.
- Modules can be visually grouped together.
- Easily extendable to create your own output formats.
Quick Start
Installation is easy as:
pip install pycallgraph
You can either use the command-line interface for a quick visualization of your Python script, or the pycallgraph module for more fine-grained settings.
The following examples specify graphviz as the outputter, so it’s required to be installed. They will generate a file called pycallgraph.png.
The command-line method of running pycallgraph is:
$ pycallgraph graphviz -- ./mypythonscript.py
A simple use of the API is:
from pycallgraph import PyCallGraph
from pycallgraph.output import GraphvizOutput

with PyCallGraph(output=GraphvizOutput()):
    code_to_profile()